01
Dashboard
Review project-scoped observations and their source captures.
Retail pricing intelligence
Aisle Trace turns store visits and shelf images into structured pricing observations for brand and research teams. Every result stays tied to the project, place, time, and source image that produced it.
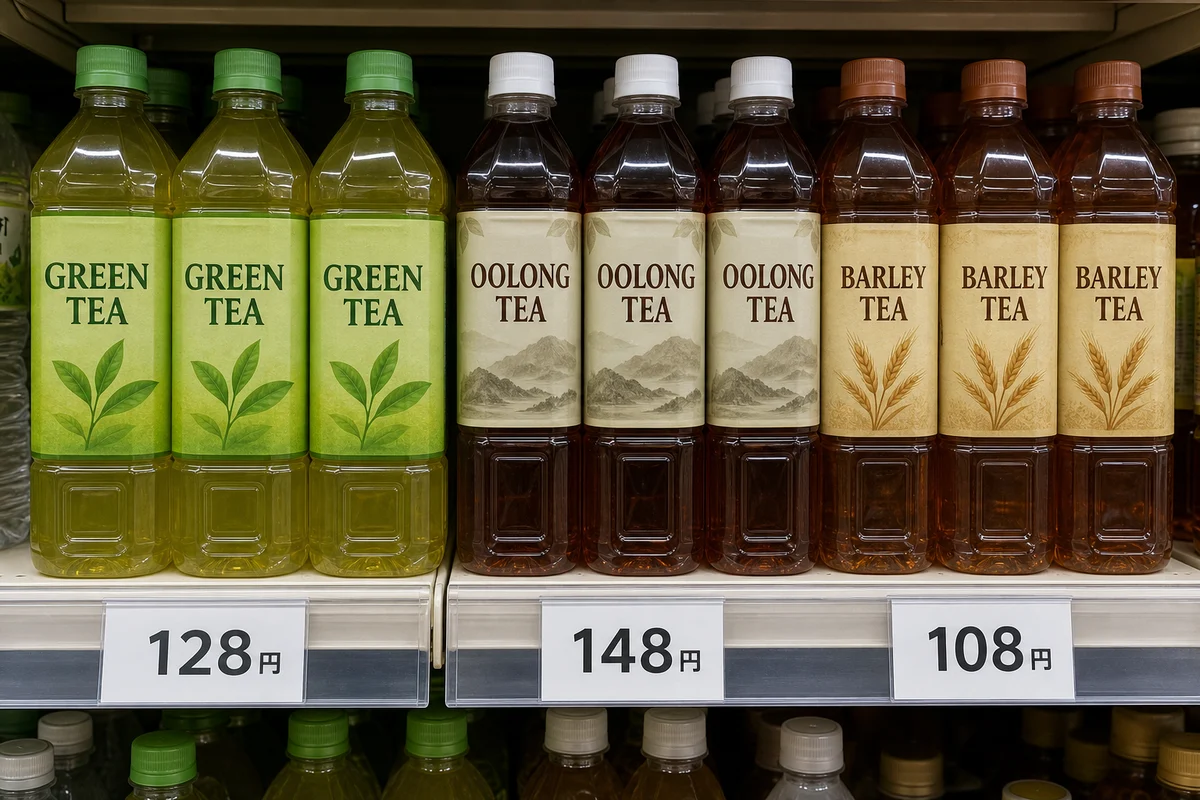 Observed ¥148
The complete path
Four concrete steps. No separate data path for dashboards, chat, exports, or agents.
Open a project and record the store, location, and capture time.
Keep products and their displayed price labels together in one clear frame.
Turn the image into structured observations with confidence and provenance.
Query products, prices, promotions, stores, and time from the same data.
See what changed
Aisle Trace keeps the source capture, product identity, store, time, confidence, and extraction version close to every value. A low price is useful. A low price you can trace is defensible.
| Fixture store A | ¥148 | 14:32 |
| Fixture store B | ¥138 | 15:10 |
| Fixture store C | ¥158 | 16:06 |
Red marks the selected observation, not a sale.
Working product
Each observation records the project, store visit, source capture, product, displayed price, promotion, time, confidence, and extraction provenance. Coverage means the visits your team collected, not every store in the market.
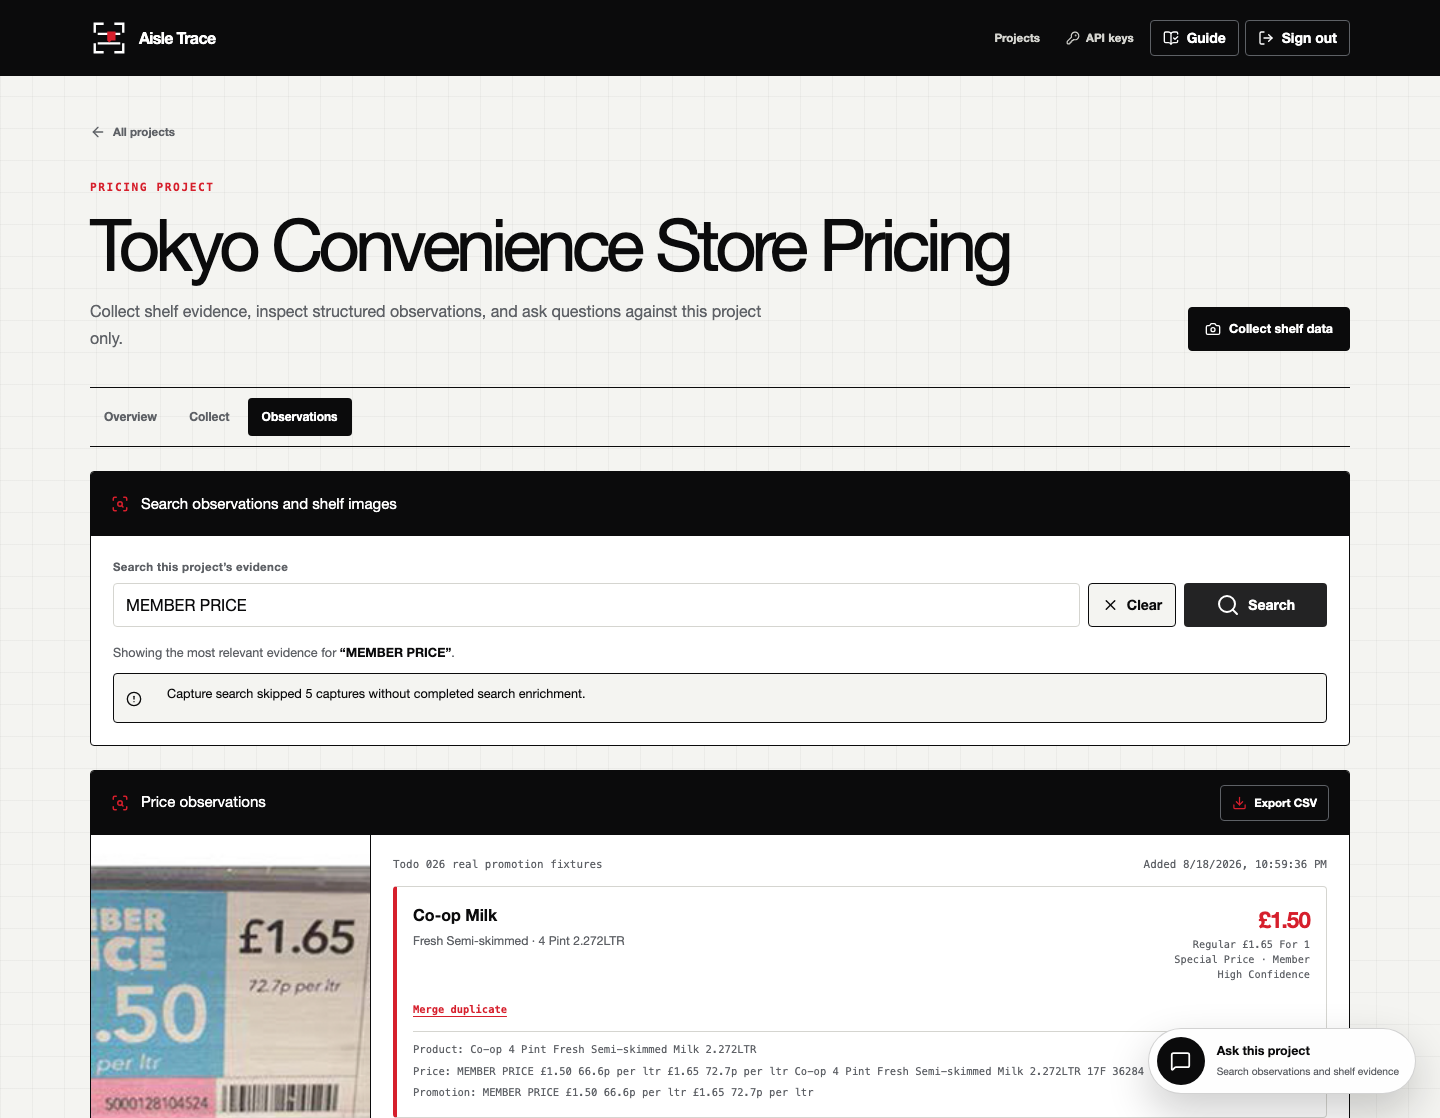
Fixture workspace shown. Narrow one project by store, product, price, promotion, or confidence.
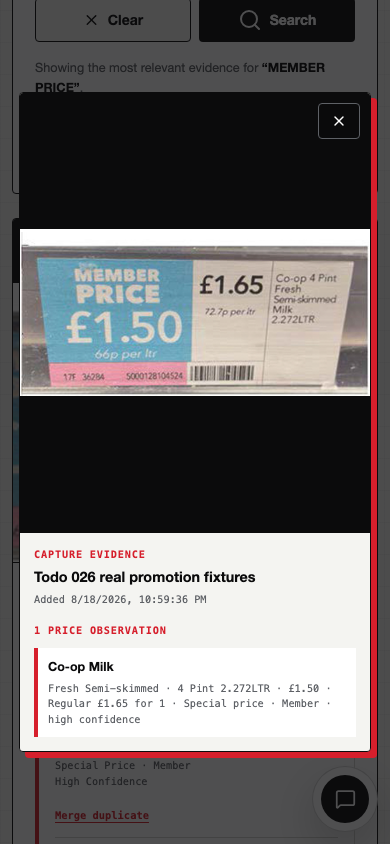
Fixture workspace shown. Review the source capture, store, time, product, price, and confidence.
For brand and research teams
We will show the working flow or shape a small pilot around the stores your team can visit.
One data layer
Review project-scoped observations and their source captures.
Ask concrete questions against the same pricing data.
Give agents and external systems the same domain operations.
Collect useful evidence from a phone during each store visit.